Faraday rotation in the ionosphere scales with the square of a SAR signal’s wavelength (). Therefore, ionospheric impacts to polarization rotation are much more pronounced in NISAR’s ~25cm L-band data than in Sentinel-1’s ~5cm C-band data.
This notebook loads NISAR L-band GSLC data and performs a Faraday rotation estimation using the circular-basis method described in equation 14 of F. J. Meyer and J. B. Nicoll’s, “Prediction, detection, and correction of Faraday rotation in full-polarimetric L-band SAR data”.
Overview
1. Prerequisites
| Prerequisite | Importance | Notes |
|---|---|---|
| The software environment for this cookbook must be installed | Necessary |
Rough Notebook Time Estimate: 10 minutes
2. Search for data
Use asf_search to find GCOV data.
2a. Perform an asf_search.search() to identify your desired product URLs
import os
import asf_search as asf
from datetime import datetime
from getpass import getpass

import warnings
warnings.filterwarnings(
    "ignore",
    message="Parsing dates involving a day of month without a year specified",
)

session = asf.ASFSession()

start_date = datetime(2026, 1, 16)
end_date = datetime(2026, 1, 18)
area_of_interest = "POINT(447.0504 24.5906)" # POINT or POLYGON as WKT (well-known-text)
pattern = r'^(?!.*QA_STATS).*'

opts=asf.ASFSearchOptions(**{
    "maxResults": 250,
    "intersectsWith": area_of_interest,
    "flightDirection": "DESCENDING",
    "start": start_date,
    "end": end_date,
    "processingLevel": [
        "GSLC"
    ],
    "dataset": [
        "NISAR"
    ],
    "productionConfiguration": [
        "PR"
    ],
    'session': session,
})

response = asf.search(opts=opts)
hdf5_urls = response.find_urls(extension='.h5', pattern=pattern, directAccess=False)
print(f"Found {len(hdf5_urls)} GSLC products:")
hdf5_urls
2c. Provide your Earthdata Login (EDL) Bearer Token
Both HTTPS and S3 access require an EDL Bearer Token
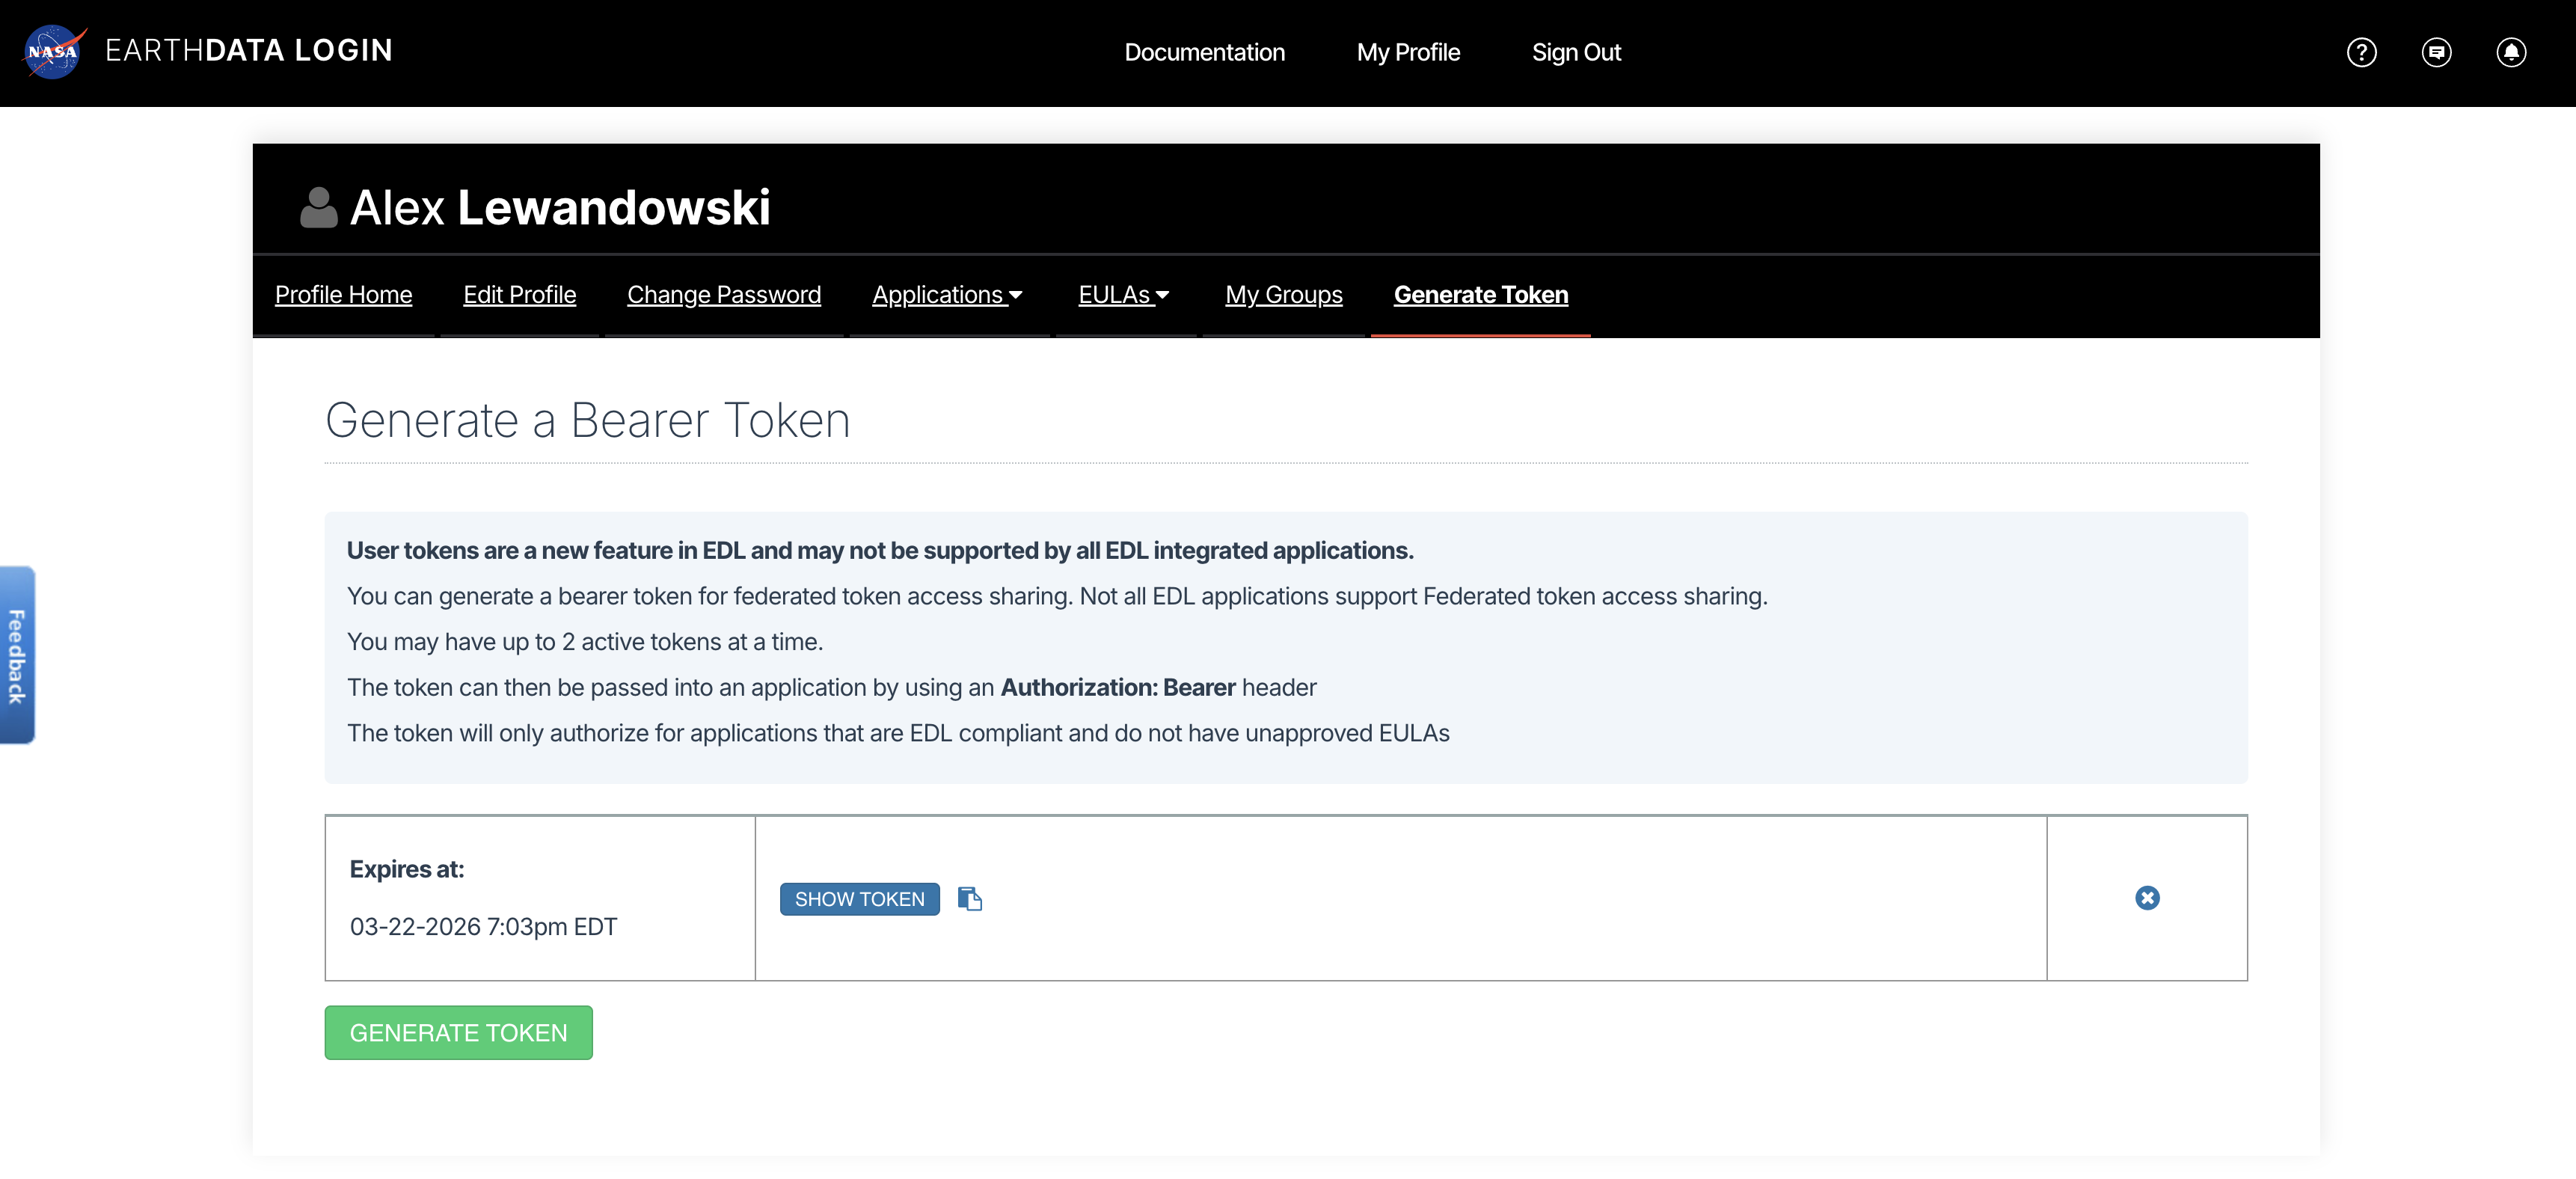
View or generate a Bearer Token in “Generate Token” tab of the Profile page in your Earthdata Login account: https://
from getpass import getpass

token = getpass("Enter your EDL Bearer Token")%%time
import asf_search as asf
import fsspec
import rioxarray
import xarray as xr
group_path = "/science/LSAR/GSLC/grids/frequencyA"
fs = fsspec.filesystem(
"http",
headers = {"Authorization": f"Bearer {token}"},
block_size = 16 * 512 * 512,
)
f = fs.open(hdf5_urls[0], "rb")
dt = xr.open_datatree(
f,
engine="h5netcdf",
decode_timedelta=False,
phony_dims="access",
chunks="auto",
group=group_path
)
display(dt)3b. Create a spatial subset
import rioxarray

ds = dt.to_dataset()
projection = ds.projection.attrs['epsg_code'].item()
ds = ds.rio.write_crs(projection) # write the project to the HHHH data for easy lat/lon subsetting

# subset the data
subset_ds = ds.rio.clip_box(
    minx=446.5857, miny=24.7935,
    maxx=446.7342, maxy=24.9244,
    crs="EPSG:4326"
)
subset_ds
4. Define functions to perform a Faraday rotation estimation over an optionally multilooked GSLC
Uses the circular-basis method for Faraday rotation estimation described in equation 14 of F. J. Meyer and J. B. Nicoll’s, “Prediction, detection, and correction of Faraday rotation in full-polarimetric L-band SAR data”
import numpy as np
import xarray as xr

def multilook_mean(da, ly=1, lx=1, x_coord="xCoordinates", y_coord="yCoordinates"):
    """
    Spatially multilook an `xarray.DataArray` by taking the mean over
    pixel windows (ly x lx).

    da : (xarray.Dataset or xarray.DataArray) 2D DataArray to multilook
    ly : (int) Number of pixels to average together in the y direction
    lx : (int) Number of pixels to average together in the x direction

    returns: Multilooked xarray.DataArray
    """
    return da.coarsen(
        {y_coord: ly, x_coord: lx},
        boundary="trim"
    ).mean()

def faraday_rotation_circular_basis(hh, hv, vh, vv,
                                    ly=10, lx=10, # multilook window
                                    x_coord="xCoordinates", y_coord="yCoordinates"):
    """
    Estimate Faraday rotation angle using the circular-basis method:

    [Z11 Z12]   [1  j] [M'hh M'vh] [1  j]
    [Z21 Z22] = [j  1] [M'hv M'vv] [j  1]

    from which we derive:

    Ω_hat = 1/4 * arg(Z12 * conj(Z21))

    M′: measured scattering matrices (linear basis)
    Ω_hat: Faraday Rotation angle estimate
    Z: circular basis (Z12: RL, Z21: LR)
    arg: argument of complex number (phase in the complex plane)

    References:
    - F. J. Meyer and J. B. Nicoll, “Prediction, detection, and correction of Faraday rotation in full-polarimetric
    L-band SAR data,” IEEE Trans. Geosci. Remote Sens., vol. 46, no. 10, pp. 3076–3086, Oct. 2008.
    https://topex.ucsd.edu/pub/sandwell/Venus_InSAR/atmosphere/meyer_nicoll_TGRS46_10_ionosphere_Polarimetry.pdf
    - S. H. Bickel and R. H. T. Bates, “Effects of magneto-ionic propagation on the
    polarization scattering matrix,” Proc. IEEE, vol. 53, no. 8, pp. 1089–1091, Aug. 1965

    hh, hv, vh, vv : (xarray.Dataset or xarray.DataArray) Complex-valued, linearly polarized image DataArrays
    ly : (int) Number of looks in y for multilooking
    lx : (int) Number of looks in x for multilooking
    x_coord: (string) DataArrays' x coordinate variable name
    y_coord: (sring) DataArrays' y coordinate variable name

    Returns: omega (xarray.DataArray) Estimated Faraday rotation angle in radians
    """

    #     Z = T * M' * T
    #
    #     T = [[1, j],
    #          [j, 1]]
    #
    # [[Z11 Z12], =  [[1, j],      [[hh, vh],    [[1, j],
    # [Z21 Z22]]  =  [j, 1]]   *   [hv, vv]]  *  [j, 1]]

    T = 1j
    # calculate the circular-basis off-diagonal terms
    z12 = (T * hh) - vh + hv + (T * vv)
    z21 = (T * hh) + vh - hv + (T * vv)

    # multilook the cross-product of the off-diagonal terms
    phase_product = z12 * np.conj(z21)

    # multilook the cross-product
    phase_product_ml = multilook_mean(
        phase_product,
        ly=ly, lx=lx,
        x_coord=x_coord, y_coord=y_coord
    )

    # P = Z12 * conj(Z21)
    # Ω_hat = 1/4 * arg(P)
    # and
    # Z=x+iy
    # cosθ = x/hyp, sinθ = y/hyp
    # θ = arctan(y/x)
    # ∴
    # arg(P)=atan2(ℑ(P),ℜ(P))
    # Ω_hat = 1/4 * atan2(ℑ(P),ℜ(P))
    omega_rad = 0.25 * xr.apply_ufunc(
        np.arctan2, # np.arctan2 avoids quadrant ambiguity
        phase_product_ml.imag, # y-coord
        phase_product_ml.real, # x-coord
        dask="parallelized",
        output_dtypes=[np.float64],
    )
    omega_rad.name = "faraday_rotation_rad"
    omega_rad.attrs["units"] = "radian"

    # Coherence-based quality metric
    # P = Z12 * conj(Z21)
    # quality = |P| / sqrt(|Z12|^2 * |Z21|^2)
    #
    # quality ≈ 1: stable phase difference, reliable FR estimate
    # quality ≈ 0: random/noisy phase difference, unreliable FR estimate
    z12_pow_ml = multilook_mean(
        np.abs(z12) ** 2,
        ly=ly, lx=lx,
        x_coord=x_coord, y_coord=y_coord
    )

    z21_pow_ml = multilook_mean(
        np.abs(z21) ** 2,
        ly=ly, lx=lx,
        x_coord=x_coord, y_coord=y_coord
    )

    quality = np.abs(phase_product_ml) / np.sqrt(z12_pow_ml * z21_pow_ml)
    quality = quality.clip(0, 1)
    quality.name = "faraday_rotation_quality"
    quality.attrs["units"] = "unitless"

    if hasattr(hh, "rio") and hh.rio.crs is not None:
        omega_rad = omega_rad.rio.write_crs(hh.rio.crs, inplace=False)
        quality = quality.rio.write_crs(hh.rio.crs, inplace=False)

    return omega_rad, quality
6. Plot the Faraday rotation over a basemap
“Faraday rotation (FR) angles of less than are generally considered acceptable for many commonly used SAR parameter extraction methods. Higher levels of FR can introduce significant errors in SAR image interpretation and analysis, particularly for polarimetric decompositions that rely on channel ratios.”
%%time

import numpy as np
import panel as pn
import holoviews as hv
import hvplot.xarray  # noqa

hv.extension("bokeh")
pn.extension()

omega_rad, quality = faraday_rotation_circular_basis(
    subset_ds.HH,
    subset_ds.HV,
    subset_ds.VH,
    subset_ds.VV,
    ly=10, # adjust multilooking window height
    lx=10, # adjust multilooking window width
)

omega_deg = np.degrees(omega_rad)
omega_deg.name = "faraday_rotation_deg"
omega_deg.attrs["units"] = "degree"

quality_thresh = 0.3 # Set quality threshold for masking
omega_deg_masked = omega_deg.where(quality >= quality_thresh)
omega_deg_masked.name = "faraday_rotation_deg_quality_masked"
omega_deg_masked.attrs["units"] = "degree"
omega_deg_masked.attrs["quality_threshold"] = quality_thresh
omega_deg_masked

omega_web = omega_deg_masked.rio.reproject("EPSG:3857")
quality_web = quality.rio.reproject_match(omega_web)
omega_web = omega_web.compute()
quality_web = quality_web.compute()

print(f"FR min/max: {float(omega_web.min())}, {float(omega_web.max())}")
mean_abs_deg = float(np.abs(omega_deg_masked).mean(skipna=True))
print(f"Mean abs FR: {mean_abs_deg}")
median_abs_deg = float(np.nanmedian(np.abs(omega_deg_masked).compute()))
print(f"Median abs FR: {median_abs_deg}")
std_deg = float(omega_deg_masked.std(skipna=True))
print(f"Std FR: {std_deg}")
print(f"Quality min/max: {float(quality_web.min())}, {float(quality_web.max())}")
print(f"Quality valid pixels: {int(quality_web.count())}")

xmin = float(omega_web.x.min())
xmax = float(omega_web.x.max())
ymin = float(omega_web.y.min())
ymax = float(omega_web.y.max())

alpha = pn.widgets.FloatSlider(name="FR alpha", start=0.0, end=1.0, step=0.05, value=1.0)
show_fr = pn.widgets.Toggle(name="Show Faraday rotation", value=True)
show_quality = pn.widgets.Toggle(name="Show quality", value=False)

tiles = hv.element.tiles.EsriImagery().opts(
    xlim=(xmin, xmax),
    ylim=(ymin, ymax),
    frame_width=700,
    frame_height=500,
    active_tools=["wheel_zoom"],
)

@pn.depends(alpha, show_fr, show_quality)
def view(alpha, show_fr, show_quality):
    layers = tiles

    if show_fr:
        fr = omega_web.hvplot.image(
            x="x",
            y="y",
            cmap="RdBu_r",
            clim=(-5, 5),
            frame_width=700,
            frame_height=500,
            title="Faraday Rotation",
        ).opts(
            alpha=alpha,
            xlim=(xmin, xmax),
            ylim=(ymin, ymax),
        )
        layers = layers * fr

    if show_quality:
        q = quality_web.hvplot.image(
            x="x",
            y="y",
            cmap="viridis",
            clim=(0, 1),
            colorbar=True,
            frame_width=700,
            frame_height=500,
            title="Faraday Rotation Quality",
        ).opts(
            alpha=1.0,
            xlim=(xmin, xmax),
            ylim=(ymin, ymax),
        )
        layers = layers * q

    return layers

pn.Column(show_fr, alpha, show_quality, view)
7. Summary
You now have the tools and knowledge that you need to search GSLC data with asf_search, stream it with ffspec and xarray, and estimate Faraday rotation caused by passage of the signal through the ionosphere.